Understanding Extract, Transform and Load (ETL) in Data Analytics world with an example in Python Code
Anyone who is into Data Analytics, be it a programmer, business analyst or database developer, has been developing ETL pipeline directly or indirectly. For data-driven businesses, ETL is a must.
What is ETL ???

ETL stands for Extract, Transform and Load. It’s a generic process in which data is firstly acquired, then changed or processed and is finally loaded into data warehouse or databases or other files such as PDF, Excel.
You can extract data from any data sources such as Files, any RDBMS/NoSql Database, Websites or real-time user activity, transform the acquired data and then load the transformed data into a data warehouse for business uses such as reporting or analytics.
Don’t confuse ETL with a tool, it’s a concept of data movement which can be established with the help of various tools such as Informatica, Tableau, Programming languages, etc.
ETL is a 3 steps process:
- Extracting Data from single or multiple Data Sources
- Transforming Data as per business logic. Transformation is in itself a two steps process- data cleansing and data manipulation.
- Loading transformed data into the target data source or data warehouse.
You may ask, Why ETL ???
Data Analytics are mostly revolving around ETL. Many of you might already be doing it one way or another by writing different functions/scripts to perform tasks on data and get some useful information out of data.
Key reasons for using ETL are:
- Visualizing your entire data flow pipeline which helps business taking critical business decisions.
- Transactional databases cannot answer complex business questions that can be answered by ETL.
- ETL provides a method of moving the data from various sources into a data warehouse.
- As data sources change, the Data Warehouse will automatically update.
- ETL process can perform complex transformations and requires the extra area to store the data.
- ETL helps to Migrate data into a Data Warehouse. Convert to the various formats and types to adhere to one consistent system.
- ETL is a predefined process for accessing and manipulating source data into the target database.
- ETL offers deep historical context for the business.
In this blog, we will establish our ETL pipeline by using Python programming language, cause thankfully Python comes with lots of different libraries that help to establish tons of Data Analytics, Data Visualization or Data Science solutions.
Let’s start with building our own ETL pipeline in python.
For the sake of simplicity our 3 steps are as follow:
* Extract data from CSV file
* Transform/Manipulate Data
* Load Data into SQL Database (Python has inbuilt SQL module — ‘sqlite3’)
CSV Data Source Link: https://raw.githubusercontent.com/diljeet1994/Python_Tutorials/master/Projects/Advanced%20ETL/crypto-markets.csv

Let’s start with python code. I am using Pandas here to read CSV file. Pandas is a great python library that is used a lot for Data Analysis purpose. It’s really easy to read data from CSV in pandas. You can follow this Github repo to learn more about Pandas.
Code snippet to read CSV file:
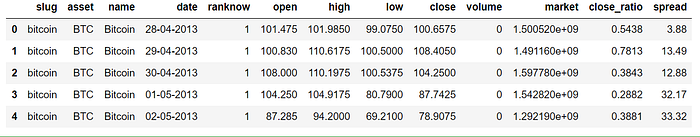
After running code you could see following dataframe as output:
So we have cryptocurrencies data with us, containing crypto token name, its open, close, high and low price on certain dates and some other columns as well. These prices are in USD and we want to save this price into GBP currency (Great Britain Pound). Also, let’s assume that some columns are irrelevant for us, so we will drop those columns in the end. Since our data does not contain any Null or blank values and its kind of structure as well so we can skip data cleansing part.
Let’s start with transforming the data. Transformation logic is to convert the price of BTC, ETH , XRP and LTC cryptocurrency only into GBP from USD. Let’s just assume that we don’t care about other currencies.
So in Python, we have to build logic to iterate through all the rows of excel file and check if the current row consists of desired cryptocurrency (BTC, ETH , XRP and LTC). If so, then we will transform its price into GBP by simply multiplying price columns with 0.80, which is the conversion rate ((1 USD = 0.80 GBP)) of USD to GBP at the time of writing this blog.
Code Snippet for Transformation part:
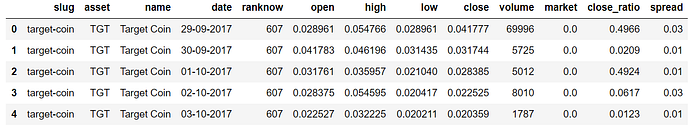
In code you can see following dataframe as output:
There are a lot of columns, let's assume that for us, relevant columns are only asset, name, date, open, high, low and close. So let’s drop other irrelevant columns.
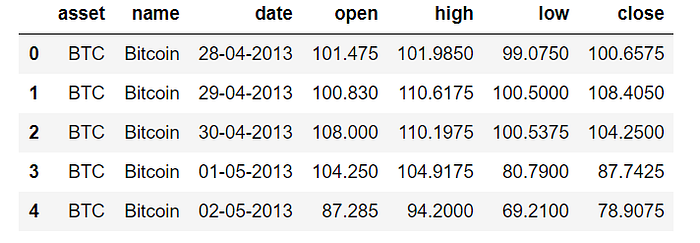
Final Data set is as below:
The final stage is to Load the transformed Data in SQL database.
One thing to keep in mind is that loading part could also be in the form of Data Visualizations (Graphs), PDF or Excel report, or database as in our case. It's just retrieval of the final data set for a further business case study.
Python does come along with an in-built SQL module ‘sqlite3’ for Python3, so we don't need to download any external library.
Code snippet to load our data into SQL:
First, I created a sql connection, then check if any database with ‘Crypto’ name exists or not. If it existed then I dropped it (Just for FUN :P). And then created table Crypto with sql query inside conn.execute() method.
For data insertion, we again need to change our data from Pandas Dataframe to Python List of Lists or List of Tuples, because that's the format sqlite module understand for data insertion. Below is the code snippet for same.
That’s a basic ETL pipeline in Python code. To get a complete jupyter notebook for the above code, use this github repo: https://github.com/diljeet1994/Python_Tutorials/tree/master/Blog%20Work/ETL/ETL%20Basic
To get a better understanding of building complex Data Analytics solution using ETL in python read out the blog mentioned below :
Have fun, keep learning, and always keep coding.
Thanks.